
Real-time telemetry analytics platform
MetricPulse needed an analytics platform that could ingest billions of telemetry events each day and return useful operational queries quickly.

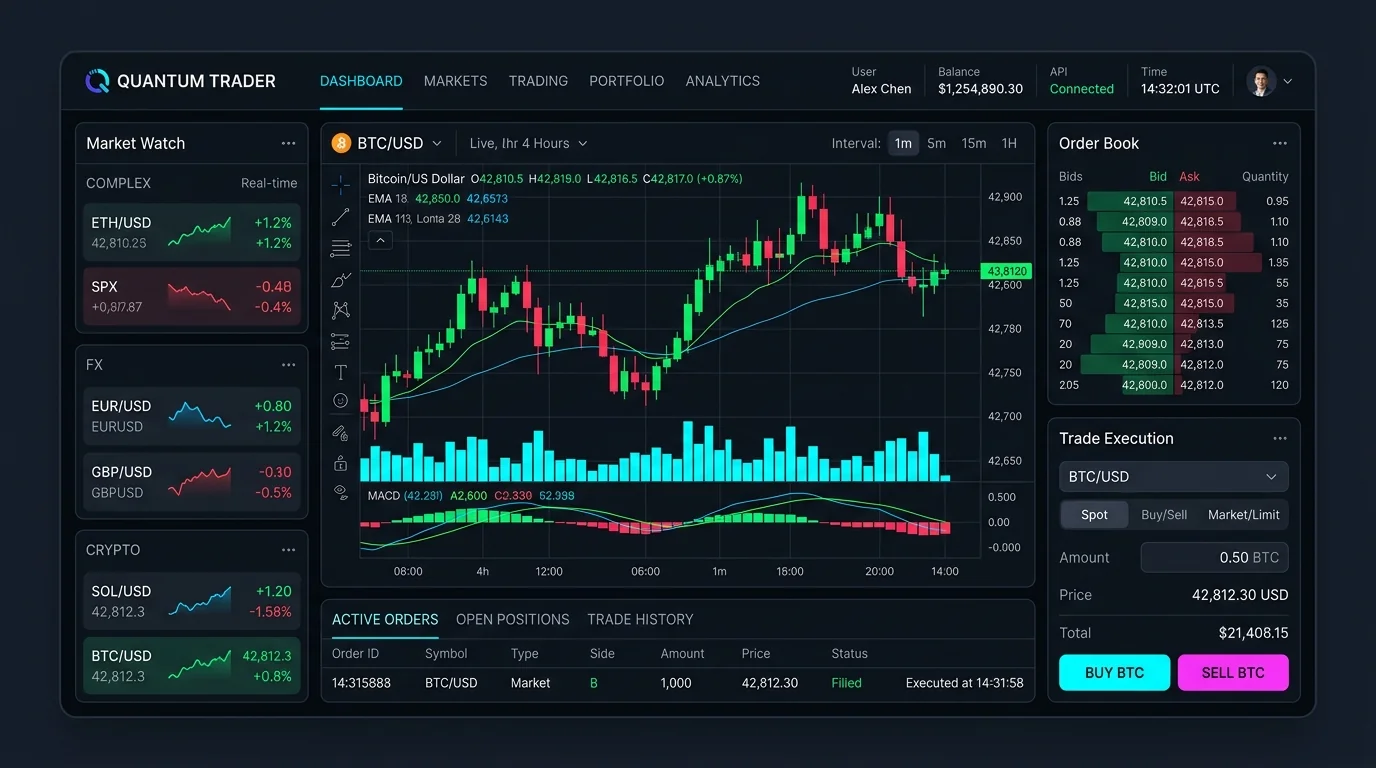
Context image for this case study; it does not depict the delivered software interface.
Our Contribution
Bitneka developed the event pipeline, analytical storage, and dashboards for operational telemetry.
Challenge and Solution
Consolidating fragmented log, metric, and trace streams into a unified high-throughput query engine.
The Problem
Legacy relational databases and elasticsearch clusters buckled under high-throughput event logging, forcing teams to use data sampling. Monthly cloud bills were ballooning, and analytical funnel queries took up to 45 seconds to finish.
- Ingestion bottlenecks dropping incoming telemetry during sudden client web traffic spikes.
- Columnar query latency causing frustrating dashboard timeouts for enterprise analysts.
- High disk storage costs accumulating across petabytes of raw event telemetry.
Our Solution
Bitneka Technologies architected a petabyte-scale event pipeline using Vector collectors, Apache Kafka buffer clusters, and ClickHouse columnar storage, paired with an interactive Next.js visualization frontend.
- 5 Billion events ingested daily with zero dropped packets and sub-50ms analytical aggregation queries.
- ZSTD columnar compression reducing raw storage footprint by 78%, saving $40,000/month in cloud disk.
- Interactive funnel and cohort retention query builder that computes complex queries across millions of rows in seconds.
How We Delivered
The team mapped telemetry sources, built ingestion and query paths, tested data volume, and deployed the analytics interface.
Data Modeling
Designed optimized ClickHouse MergeTree schema partitions and materialized views for common queries.
Ingestion Pipeline
Deployed Vector and Kafka clusters to ingest 60,000 events/second per node without backpressure.
Analytical UI
Engineered responsive canvas-rendered charts in Next.js capable of plotting millions of data points.
Cluster Hardening
Benchmarked 3-node replication and disaster recovery failover under synthetic traffic loads.
Distributed Trace & Enterprise Observability Pipeline
High-cardinality telemetry ingestion collecting traces, metrics, and logs across thousands of microservices with sub-second querying.
-
Stage 01
OpenTelemetry Instrumentation
Auto-Instrumented Spans, Metrics & Logs
W3C Trace Context -
Stage 02
Fluent Bit & Vector Collectors
Edge Filtering, Deduplication & Masking
PII Sanitization -
Stage 03
High-Capacity Message Queue
Kafka Ingestion Buffer for Load Spikes
1M Events/Sec -
Stage 04
Columnar Analytics Engine
ClickHouse & Prometheus Storage Layer
Compressed Storage -
Stage 05
SLO Heatmaps & Incident Alerts
Grafana Telemetry & PagerDuty Automation
Sub-Second Query
What We Built
Zero-copy streaming pipeline, SQL-accessible real-time telemetry, and automated threshold alert routing.
Zero-Sampling Event Ingestion
Ingests every click, API call, and telemetry packet with 100% data fidelity and zero sampling.
Real-Time Funnel Analysis
Build multi-step user conversion funnels and uncover drop-off steps across billions of events in seconds.
Cohort Retention Heatmaps
Analyze user cohort retention patterns week-over-week with dynamic segment filtering.
Sub-50ms Columnar Aggregations
ClickHouse columnar architecture executes complex aggregations across 500M rows in milliseconds.
Anomalous Spike & Drop Alerts
Machine learning heuristics automatically detect unexpected traffic drops or API latency surges.
GDPR & Privacy Compliance
Automated IP anonymization and user deletion pipelines honoring "Right to be Forgotten" mandates.
Technology Used
Apache Kafka, ClickHouse columnar analytical storage, and OpenTelemetry instrumentation.
Frontend & UI
Backend & APIs
Data & AI Layer
Cloud & DevOps
Results
Log ingestion throughput and query response latency achieved over petabyte-scale operational infrastructure.
About these results: Figures cover telemetry volume, query speed, storage cost, and ingestion uptime. Reporting periods can differ by measure; confidential implementation details are summarized.
"Bitneka Technologies took our data infrastructure from slow and costly to lightning-fast. Ingesting 5 billion events a day used to crash our Elasticsearch cluster; now ClickHouse responds in 40 milliseconds, and our AWS bill dropped by over half."
Related Case Studies


Working with high-volume operational data?
Tell us what data arrives, how quickly teams need answers, and what decisions the dashboard should support.